
Statistical Analysis:
Significance and Confidence Intervals
See also: Developing and Testing Hypotheses
In any statistical analysis, you are likely to be working with a sample, rather than data from the whole population. Your result may therefore not represent the whole population—and could actually be very inaccurate if your sampling was not very good.
You therefore need a way of measuring how certain you are that your result is accurate, and has not simply occurred by chance. Statisticians use two linked concepts for this: confidence and significance.
This page explains these concepts.
Statistical Significance
The term significance has a very particular meaning in statistics. It tells you how likely it is that your result has not occurred by chance.
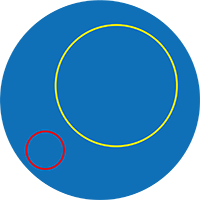
In the diagram, the blue circle represents the whole population. When you take a sample, your sample might be from across the whole population. However, it is more likely to be smaller. If it is all from within the yellow circle, you would have covered quite a lot of the population. However, you might also be unlucky (or have designed your sampling procedure badly), and sample only from within the small red circle. This would have serious implications for whether your sample was representative of the whole population.
One of the best ways to ensure that you cover more of the population is to use a larger sample. Your sample size strongly affects the accuracy of your results (and there is more about this in our page on Sampling and Sample Design).
However, another element also affects the accuracy: variation within the population itself. You can assess this by looking at measures of the spread of your data (and for more about this, see our page on Simple Statistical Analysis). Where there is more variation, there is more chance that you will pick a sample that is not typical.
The concept of significance simply brings sample size and population variation together, and makes a numerical assessment of the chances that you have made a sampling error: that is, that your sample does not represent your population.
Significance is expressed as a probability that your results have occurred by chance, commonly known as a p-value. You are generally looking for it to be less than a certain value, usually either 0.05 (5%) or 0.01 (1%), although some results also report 0.10 (10%).
Null and Alternative Hypothesis
When you carry out an experiment or a piece of market research, you generally want to know if what you are doing has an effect. You can therefore express it as a hypothesis:
• x will have an effect on y.
This is known in statistics as the ‘alternative hypothesis’, often called H1.
The ‘null hypothesis’, or H0, is that x has no effect on y.
Statistically speaking, the purpose of significance testing is to see if your results suggest that you need to reject the null hypothesis—in which case, the alternative hypothesis is more likely to be true.
If your results are not significant, you cannot reject the null hypothesis, and you have to conclude that there is no effect.
The p-value is the probability that you would have obtained the results you have got if your null hypothesis is true.
Calculating Significance
One way to calculate significance is to use a z-score. This describes the distance from a data point to the mean, in terms of the number of standard deviations (for more about mean and standard deviation, see our page on Simple Statistical Analysis).
For a simple comparison, the z-score is calculated using the formula:
$$z=\frac{x - \mu}{\sigma}$$where \(x\) is the data point, \(\mu\) is the mean of the population or distribution, and \(\sigma\) is the standard deviation.
For example, suppose we wished to test whether a game app was more popular than other games. Let’s say that the average game app is downloaded 1000 times, with a standard deviation of 110. Our game has been downloaded 1200 times. Its z score is:
$$z=\frac{1200-1000}{110}=1.81$$A higher z-score signals that the result is less likely to have occurred by chance.
You can use a standard statistical z-table to convert your z-score to a p-value. If your p-value is lower than your desired level of significance, then your results are significant.
Using the z-table, the z-score for our game app (1.81) converts to a p-value of 0.9649. This is better than our desired level of 5% (0.05) (because 1−0.9649 = 0.0351, or 3.5%), so we can say that this result is significant.
Note that there is a slight difference for a sample from a population, where the z-score is calculated using the formula:
$$z=\frac{(x-\mu)}{(\sigma/\sqrt n)}$$where x is the data point (usually your sample mean), µ is the mean of the population or distribution, σ is the standard deviation, and √n is the square root of the sample size.
An example will make this clearer.
Suppose you are checking whether biology students tend to get better marks than their peers studying other subjects. You might find that the average test mark for a sample of 40 biologists is 80, with a standard deviation of 5, compared with 78 for all students at that university or school.
$$z=\frac{(80-78)}{(5/\sqrt 40)}=2.53$$Using the z-table, 2.53 corresponds to a p-value of 0.9943. You can subtract this from 1 to obtain 0.0054. This is lower than 1%, so we can say that this result is significant at the 1% level, and biologists obtain better results in tests than the average student at this university.
Note that this does not necessarily mean that biologists are cleverer or better at passing tests than those studying other subjects. It could, in fact, mean that the tests in biology are easier than those in other subjects. Finding a significant result is NOT evidence of causation, but it does tell you that there might be an issue that you want to examine.
There is more about testing for significance of sample means, and testing differences between groups, in our page on Hypothesis Development and Testing.
Confidence Intervals
A confidence interval (or confidence level) is a range of values that have a given probability that the true value lies within it.
Effectively, it measures how confident you are that the mean of your sample (the sample mean) is the same as the mean of the total population from which your sample was taken (the population mean).
For example, if your mean is 12.4, and your 95% confidence interval is 10.3–15.6, this means that you are 95% certain that the true value of your population mean lies between 10.3 and 15.6. In other words, it may not be 12.4, but you are reasonably sure that it is not very different.
The diagram below shows this in practice for a variable that follows a normal distribution (for more about this, see our page on Statistical Distributions).
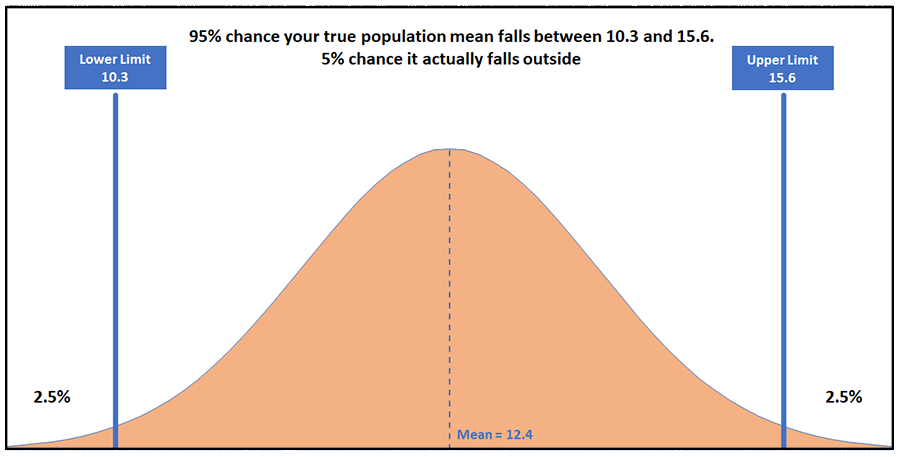
The precise meaning of a confidence interval is that if you were to do your experiment many, many times, 95% of the intervals that you constructed from these experiments would contain the true value. In other words, in 5% of your experiments, your interval would NOT contain the true value.
You can see from the diagram that there is a 5% chance that the confidence interval does not include the population mean (the two ‘tails’ of 2.5% on either side). In other words, in one out of every 20 samples or experiments, the value that we obtain for the confidence interval will not include the true mean: the population mean will actually fall outside the confidence interval.
Calculating the Confidence Interval
Calculating a confidence interval uses your sample values, and some standard measures (mean and standard deviation) (and for more about how to calculate these, see our page on Simple Statistical Analysis).
It is easiest to understand with an example.
Suppose we sampled the height of a group of 40 people and found that the mean was 159.1 cm, and the standard deviation was 25.4.
Standard deviation for confidence intervals
Ideally, you would use the population standard deviation to calculate the confidence interval. However, it is very unlikely that you would know what this was.
Fortunately, you can use the sample standard deviation, provided that you have a big enough sample. The cut-off point is generally agreed to be a sample size of 30 or more, but the bigger, the better.
We need to work out whether our mean is a reasonable estimate of the heights of all people, or if we picked a particularly tall (or short) sample.
We use a formula for calculating a confidence interval. This is:
$$mean \pm z \frac{(SD)}{\sqrt n}$$Where SD = standard deviation, and n is the number of observations or the sample size.
The z value is taken from statistical tables for our chosen reference distribution. These tables provide the z value for a particular confidence interval (say, 95% or 99%).
In this case, we are measuring heights of people, and we know that population heights follow a (broadly) normal distribution (for more about this, see our page on Statistical Distributions).We can therefore use the values for a normal distribution.
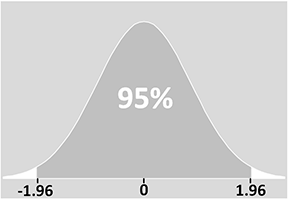
The z value for a 95% confidence interval is 1.96 for the normal distribution (taken from standard statistical tables).
Using the formula above, the 95% confidence interval is therefore:
$$159.1 \pm 1.96 \frac{(25.4)}{\sqrt 40}$$When we perform this calculation, we find that the confidence interval is 151.23–166.97 cm. It is therefore reasonable to say that we are therefore 95% confident that the population mean falls within this range.
Understanding z score or z value
The z-score is a measure of standard deviations from the mean. In our example, therefore, we know that 95% of values will fall within ± 1.96 standard deviations of the mean:
Assessing Your Confidence Interval
As a general rule of thumb, a small confidence interval is better. The confidence interval will narrow as your sample size increases, which is why a larger sample is always preferred. As our page on sampling and sample design explains, your ideal experiment would involve the whole population, but this is not usually possible.
Conclusion
Confidence intervals and significance are standard ways to show the quality of your statistical results. You will be expected to report them routinely when carrying out any statistical analysis, and should generally report precise figures. This will ensure that your research is valid and reliable.