
Multivariate Analysis
See also: Research MethodsOur pages Simple Statistical Analysis, Developing and Testing Hypotheses and Significance and Confidence Intervals explain some of the simpler techniques used for statistical analysis. This page discusses some of the more advanced techniques, involving several variables and not just one or two.
In real life, as opposed to laboratory research, you are likely to find that your data are affected by many things other than the variable that you wish to test. There are correlations between items that you’ve never considered, and the world is complex.
The purpose of advanced statistical analysis is to simplify some of the relationships, while making a more effective model of what you are seeing.
There are Four Ways to Simplify Analysis
- Design
- Using Sub-Samples
- Using Statistical Controls
- Multivariate Analysis
1. Design
You can design your research so that causal factors are made independent of each other. For example, if you think that there may be a link between age and salary, then a random sample of employees will risk combining the effects of both. If, however, you divide the population into groups by age, and then randomly sample equal numbers from each group, you have made age and salary independent.
2. Using Sub-Samples
Here, you select your sample to be equal on any potentially confounding factors. For example, job type may affect pay, so if you want to study the effects of another factor on pay, you could select only people doing the same job.
3. Using Statistical Controls
If you suspect that three variables may be linked, you can control for one to test for correlations between the other two. Effectively, you adjust the statistical value of the control to be constant, and test whether there is still a relationship between the other two variables. You may find that the observed relationship remains high (it is real), or reduces considerably (there is probably no real relationship). There is a third case: where there is no relationship until you control the third variable, which means that the control variable is masking the relationship between the other two.
4. Multivariate Analysis
Multivariate Analysis includes many statistical methods that are designed to allow you to include multiple variables and examine the contribution of each.
The factors that you include in your multivariate analysis will still depend on what you want to study. Some studies will want to look at the contribution of certain factors, and other studies to control for those factors as (more or less) a nuisance.
Two types of variables
In multivariate analysis, the first thing to decide is the role of the variables.
There are two possibilities:
- The variable causes an effect: predictor variable
- The variable is affected: dependent variable
This is a function of your model, not of the variables themselves, and the same variable may be either in different studies.
The relationships between variables are usually represented by a picture with arrows:
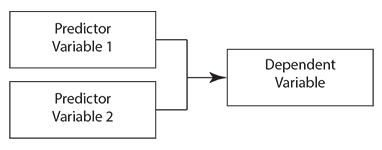
You can also observe variables directly, or infer them from what is happening. These are known as latent variables.
Example: Success at School
It is hard to measure ‘success at school’: it is a latent variable.
You might decide that 'success at school' consists of academic success, together with some measure of social success (perhaps average duration of friendships, or size of ‘friendship group’) plus one of effort put in (which you could measure as perceptions of either students or teachers). These are your observed variables.
The measurement model examines the relationship between the observed and latent variables.
Subjective and objective variables
Whenever you are doing research, there are likely to be different types of data involved. For example, here there are both objective data (academic success, average duration of friendship) and subjective data (perceived effort). The type of data that you choose will have an effect on the quality of your research, and also on the conclusions that you can draw.
There is more about this in our page on Types of Data.
The idea behind such models is that there are correlations between the observed and latent variables (to understand more, you may like to read our page on Correlations).
These correlations are assumed to be caused by common factors. The greater the influence of the common factors (the factor loading), the higher the correlations between the latent and observed variables. You therefore need to measure these correlations to assess reliability, which you can do in several ways. One of the most common is using a construct called Cronbach’s alpha (which most statistical software packages will calculate for you). This assesses whether your observed variable actually measures the latent variable of interest, that is, whether the observed variable is a reliable test for the latent variable. A value of 0.70 or more gives a good level of reliability to the model.
Cronbach’s alpha is used to measure the correlations between variables. A value of 0.70 or more gives a good level of reliability to the model.
Analysing Measurement Models in Multivariable Analysis
There are a variety of methods of analysis for measurement models like this. They include Confirmatory Factor Analysis and Exploratory Factor Analysis, and are usually carried out by computer.
The details of how to carry out each one are beyond the scope of this page, but the basic idea is that they measure how much of the variation seen in the overall construct is caused by each factor.
Causal Models
Causal models look at the way in which variables relate to each other. While it is not possible to prove causality beyond doubt, causal models allow you to say whether the suggested relationship fits the data, and how well.
The strength or weakness of any causal model is the selection of the variables. If you miss out a major causal factor, then your conclusions will be either limited or incorrect. It is therefore worth taking time on defining your model as carefully as possible.
There is a balance to be struck between simplicity and including more variables to obtain a better fit. Obviously you do not want to miss out a major causal variable, and including more variables will always give a better fit. But you need to consider whether the additional complexity is worth it for the gain in quality of the model.
Suitable analysis methods for causal models tend to be what is called generalised linear models, which include logistic regression analysis, multiple regression analysis, multivariate analysis of covariance (MANCOVA) and multivariate analysis of variance (MANOVA).
All these methods give you a measure of how much of the variation in the dependent variables is caused by the predictors, and thus whether your model is any good.
Again, there are computer packages that can do these analyses for you, but do make sure that you understand what you’re doing and are interpreting the results correctly.
Structural Equation Modelling brings together measurement models and causal models. It is a computer-modelling technique that fits a structural equation to the model. This technique is complicated, but in essence compares possible models and identifies the one that best fits the data.
A Complex Area
The world is a complex place, and sometimes the only way to understand what’s going on is to use advanced statistical techniques for modelling.
However, these too are complex and you should not embark on them without understanding the basics. If you don’t, then it’s a good idea to consult someone who does, usually a statistician. Even if you’ve used the technique before, it’s still a good idea to get a statistician to have a look at what you’re planning to do and check your results afterwards in case of any glaring errors.
Poor analysis will undermine good research very quickly.