
Statistical Analysis: Types of Data
See also: Understanding CorrelationsOur page on Observational Research and Secondary Data described two main sources of data (your own research, and data that have been previously published). However, there are also many different types of data—and data can be classified in several different ways. The type of data will affect the ways that you can use it, and what statistical analysis is possible. It will also affect conclusions and inferences that you can draw.
The choice of data type is therefore very important. This page describes some of the distinctions in data types, and the implications for research methods and findings.
Quantitative vs. Qualitative Data
The first and most obvious distinction is between quantitative and qualitative data:
Quantitative data are numerical: they can be collected and presented as numbers; and
Qualitative data are not numerical.
Our page on qualitative and quantitative research explains this distinction in more detail, and sets out the advantages and disadvantages of both.
Objective vs. Subjective Data
Data can also be divided into objective and subjective.
Objective data are observable and measurable. They include things like height, weight or number of elements. They are usually collected through observations or direct measurements.
Subjective data are collected from personal communications from individuals. This may be spoken or written, but can also take other forms. For example, body language can provide subjective information (“She lay still, with her eyes closed and her mouth tight [objective], like she was in pain [subjective]”).
Both objective and subjective data can be both qualitative and quantitative. For example, you can observe (objective) a colour change (qualitative), and you can ask people to express their opinions on an issue (subjective) using a numerical scale (quantitative).
Both types have advantages and disadvantages. For example, subjective data can provide a much broader range of information, because many things are simply unmeasurable. These include variables such as level of pain, where everyone has their own interpretation. Even using a scale of 1 to 10, which makes the data quantitative, does not mean that it will be directly comparable between individuals.
However, subjective data also depend on people remembering and assessing things accurately. Subjective data are therefore likely to be more unreliable when people have to remember events from longer ago.
Where possible, therefore, objective data are preferred, but there is a general understanding that sometimes only subjective data are available.
Longitudinal vs. Cross-Sectional Data
The distinction between longitudinal and cross-sectional data is actually more of a distinction in study design than data type.
Longitudinal studies work with the same group over time. They can therefore show changes over time and identify causation.
Cross-sectional studies may collect data at different points in time, but from different groups. They can therefore only ever show a snapshot or series of snapshots in time.
The crucial distinction between the two types of study, and therefore data, is that longitudinal data can demonstrate causation.
It is generally considered impossible to demonstrate causation from cross-sectional data, because you only have information about a moment in time. It is therefore not possible to change something, and see what effect it has (that is, if there is a causal relationship).
However, cross-sectional studies are much more convenient. You only have to carry out a single survey or piece of research, rather than follow a cohort over time. Longitudinal studies can give very high-quality data, and show causes, but suffer from problems such as dropout of the cohort. It is also hard to get funding for long-term, high-quality longitudinal studies.
Example: Combining Cross-Sectional and Longitudinal Research
The Surrey Communication and Language in Education Study (SCALES) is a good example of a long-term longitudinal study, which also included some cross-sectional elements.
The first element of the study was a large-scale survey of children in the Reception year at 180 primary schools in Surrey. All children in the population were screened for language abilities at school entry, via a survey completed by class teachers for each child. They were asked about behaviour, language and social skills. This gave a snapshot of language abilities on school entry, and enabled the researchers to assess whether the curriculum matched ability, and establish that younger children were more likely to have language problems.
The next stage selected a sample of 590 children from those screened, stratified using the findings from the first stage to give a range of language abilities. They were seen by a researcher in Year 1, and again in Year 3, and their language skills were assessed. Parents were also asked to provide information about language and behaviour at both points.
The next stage followed up the original SCALES cohort in Years 6 and 8, to assess their social, emotional and mental health outcomes.
The researchers were interested in the link between language development in early childhood, and social and emotional development in adolescence. This kind of information simply cannot be gathered from a cross-sectional study, or from two separate studies at different ages. You could ask participants and parents to think back, but the time gap is such that recollection is unlikely to be reliable.
Categorical, Continuous, Discrete and Ranked Data
Another distinction is categorical, continuous, discrete or ranked data:
Categorical data are divided into distinct groups or categories.
They therefore include, for example, gender, whether you like ice cream, and if you have ever visited a particular country. They may also include age if it is grouped into ten- or five-year chunks.
Continuous data are defined as those that can take an infinite number of values between any two values.
This sounds complicated, but is actually simple. These are data like weight or height, which can be any value within the range of possible weights and heights, not fixed values, or percentage of a class that likes ice cream (any value within the range 0-100%). Each data point is a distinct and separate number, and does not fall into a group. Age, for example, would be included if you are measuring it very precisely in days or fractions of a year, rather than whole years.
Discrete data are defined as those that have a defined number of possible values between any two values
Discrete data therefore include the number of customer complaints, or the number of people who like ice cream, i.e. you cannot have half a complaint, or a third of a person. Another example would be age in whole years. For the purposes of analysis, discrete data are considered very similar to continuous data.
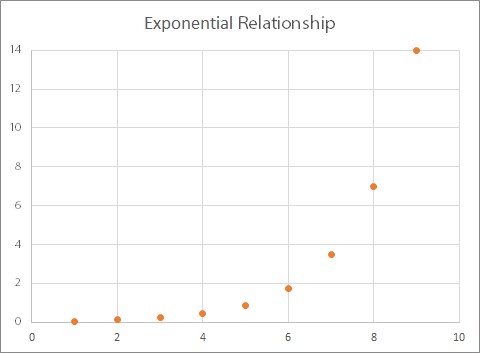
Ranked data have been sorted and ordered, and then numbered by their rank order
For example, if you had four bits of data with values 4, 6, 3, and 7, you could rank them in ascending order as 3, 4, 6, and 7. They would then take their rank order, so 3 would be 1 (1st), 4 would be 2 (2nd), and so on. Data are generally ranked when all that interests you is the order, and not the absolute values. This is usually the case when two variables change together, but do not have a straight-line relationship (that is, they change at different rates). For example, the graph below shows this type of relationship (in this case, exponential).
Warning!
It is important to remember that when you rank data, you lose information.
This should therefore only be done when you really need to do it.
These four types of data are suitable for different types of analysis—and you will need to use different statistical tests and forms of analysis for each.
For more about using different types of data for analysis, you may like to look at our page on Correlations.
Further Reading from Skills You Need
Data Handling and Algebra
Part of The Skills You Need Guide to Numeracy
This eBook covers the basics of data handling, data visualisation, basic statistical analysis and algebra. The book contains plenty of worked examples to improve understanding as well as real-world examples to show you how these concepts are useful.
Whether you want to brush up on your basics, or help your children with their learning, this is the book for you.
Conclusion
There are many different types of data that you may collect as part of your research. The choice of data type is usually driven by your research methods, which in turn are driven by your research question and your general approach to research. However, the choice of data type also has implications for the type of analysis, and the conclusions that you can draw.