An Introduction to Cartesian Coordinate Systems
See also: Graphs and ChartsWhether you are presenting data on a line graph, plotting a route by boat along the coast, or simply finding the location of a car park on a map of a National Park, you will need to have an understanding of point coordinates.
A point is a single location anywhere. It could be on a straight line (one dimension), on a two-dimensional surface or plane (for example a dot on a sheet of paper) or in three-dimensional space (such as the position of an aircraft in flight at a given instant in time).
The point itself is non-dimensional (i.e. it has no dimensions or measurable size). Its position is what is important. Every point you can think of, every atom in space, has its own unique place occupied only by itself. This place might change with time (the aircraft flies from A to B), but at any given instant, it has a unique location. Every point has an address, called its coordinates, which describes its location relative to another known location.
On a two-dimensional plane, a point can be described by a pair of coordinates, within a coordinate system, such as (x,y). In a three-dimensional space, a point can be described by three coordinates, e.g. (x, y, z). The most common coordinate systems that you are likely to encounter are Cartesian coordinate systems. These are used where the plane, surface or space can be described in flat, rectangular dimensions (like a box, or a square grid).
However, where there are curved lines, surfaces and spaces involved, it is necessary to use a system derived from circular shapes. For more on this, see our page on polar, spherical or cylindrical coordinate systems.
Two-Dimensional Cartesian Coordinates
A Cartesian coordinate system on a two-dimensional plane is defined by two perpendicular axes.
In other words, two lines drawn at right angles to each other on a flat surface (for example a flat sheet of paper, a thin pane of glass or the surface of a football field) provide a reference grid for every point on that surface. You might also see this type of system referred to as a rectangular or orthogonal coordinate system, because the reference axes are perpendicular.
A typical Cartesian coordinate system is defined by x and y axes. Each axis has a unit of length or distance (such as metres or miles). Any point within the coordinate system is described by a distance relative to both the x and y axes, (x,y). The axes cross at the point where the value of both x and y is zero; this is called the origin (0,0).
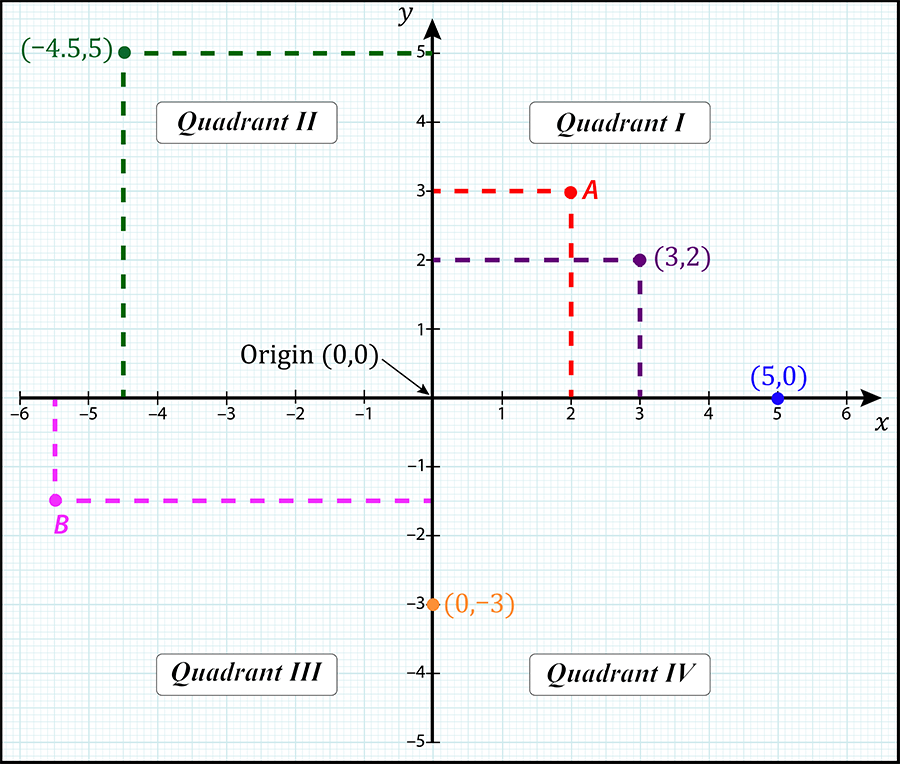
Below is an example showing the coordinates of five different points within a two-dimensional Cartesian system with the axes conventionally labelled as x (horizontal) and y (vertical). Each of the five points is defined by two numbers, the first of which is its distance perpendicular to the y-axis (its x value) and the second is its distance perpendicular to the x axis (its y value). Note that the direction from the origin is also important, as this will determine whether the values of x and y are positive or negative.

When you come across a diagram such as the one above, for example a map or perhaps a collection of data, you are likely to need to do one of two things:
- Either you have a point on a chart and you need to determine its coordinates;
- Or you have the coordinates and you need to work out the location of the point.
Determining the coordinates of a point
To determine the coordinates of a point, consider Point A in the diagram (marked in red in the positive x and y quadrant, or Quadrant 1). First, measure how far it is along the x-axis from the origin, i.e. its perpendicular distance from the y-axis. This provides your x coordinate, which has a value of 2. Next, measure how far the point is along the y-axis, in a perpendicular direction from the x axis. This gives your y coordinate, which has a value of 3.
The coordinates of Point A are therefore (2,3).
Finding the location of a point from its coordinates
In the second instance, you might be given the coordinates (−5.5, −1.5) and need to find the position of that point on the graph or map. In this case, you first travel along the negative x-axis until you reach the value −5.5. Then from that position, move in a perpendicular direction −1.5 units, i.e. 1.5 units parallel to the negative y axis, and mark your point. Alternatively you can draw a vertical line at x=−5.5 and horizontal line at y=−1.5.
Where the two lines intersect is the point (−5.5, −1.5), which is shown on the diagram as Point B, in Quadrant 3.
Warning! Sequence is significant!
When reading or writing coordinates, it is very important that they are always in the order x, y. Looking at Quadrant 1 on the diagram, you can see that Point A (2,3) is in a completely different location to point (3,2)!
Coordinate Axes: An Important Convention
Cartesian coordinate systems often have axes labelled x and y, but that is not always the case. However, it is important to clearly distinguish one from the other, as point (x,y) is not the same as point (y,x).
In common usage, the horizontal (x) axis is called the abscissa and the vertical (y) axis is called the ordinate. The abscissa and the ordinate are the first and second coordinate of any point in the coordinate system, regardless of whether the axes are labelled x and y or anything else.
If you find it tricky to recall which of the axes is the Abscissa or Ordinate, remember that in the alphabet, x comes before y and A comes before O. You can also imagine going Along the corridor then up the stairs!
Three-Dimensional Cartesian Coordinates
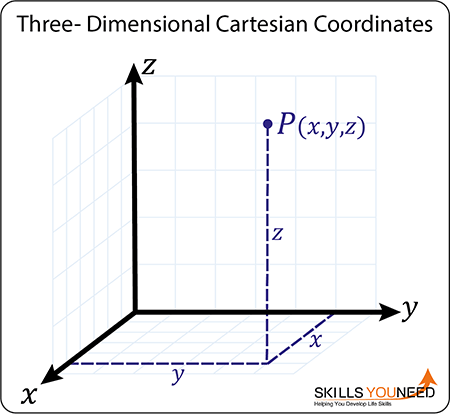
In a three-dimensional Cartesian coordinate system, the position of the point in space needs to be described by three coordinates, typically (x,y,z). In a two-dimensional system, the point is somewhere on a flat plane. However, a plane has only a length and a breadth, whereas a three-dimensional space must also have a height or a depth. In this case you can imagine the point as being somewhere within a rectangular box.
The first two coordinates, x and y, are determined in the same way as in a two-dimensional system. These describe the position of the point if it were projected downwards (or upwards) at right angles onto the x-y plane. To make this easier to visualise, imagine holding a ball in your hand, arm outstretched at shoulder height. The ball is your point. If you drop the ball, it bounces on the ground, immediately below the position of your hand. If the ground is the x-y plane, the point at which the ball bounces is the point’s (x,y) coordinate.
The three-dimensional system also has a z-axis, which lies perpendicular to the x-y plane. The position above the ground that you were holding the ball is its z coordinate. The origin of a three-dimensional Cartesian system is the point at which x, y and z are all equal to zero (0,0,0).
In mathematical terms, a point P in a typical three-dimensional Cartesian coordinate system is shown in the diagram below. P is equivalent to the ball in our example.

It is unlikely that you will need to use 3D Cartesian coordinate systems in everyday life unless you are involved with engineering, physics, architecture or other applications of computer-aided design. However, it is helpful to understand how they work. Many 3D design and drawing packages used at home work on these principles, so a basic knowledge of spatial geometry is often valuable to use them successfully.
Applications of Cartesian Coordinates
Use of Cartesian coordinates when creating graphs of algebraic equations
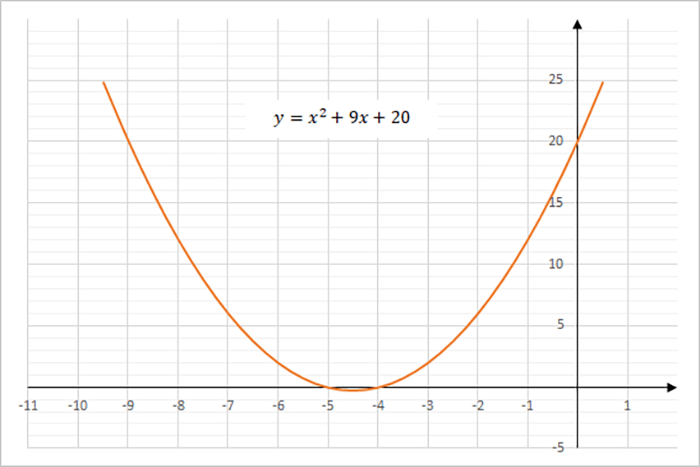
In mathematics, there will be times when it is necessary to plot a graph from an algebraic equation, to fully understand and interpret its characteristics. An equation in the form \(y\) =ƒ(\(x\)), (\(y\) as a function of \(x\)), can be drawn on Cartesian coordinates. For each value of \(x\), you can determine the value of \(y\) from the equation and therefore each point on the graph (\(x\),\(y\)) can be plotted.
The diagram below illustrates the characteristic curve of the quadratic equation
$$y = x^2 + 9x + 20$$

For more information, see our pages on Graphs and Charts and Quadratic Equations.
Applying Cartesian coordinates to map reading skills
Imagine a friend says
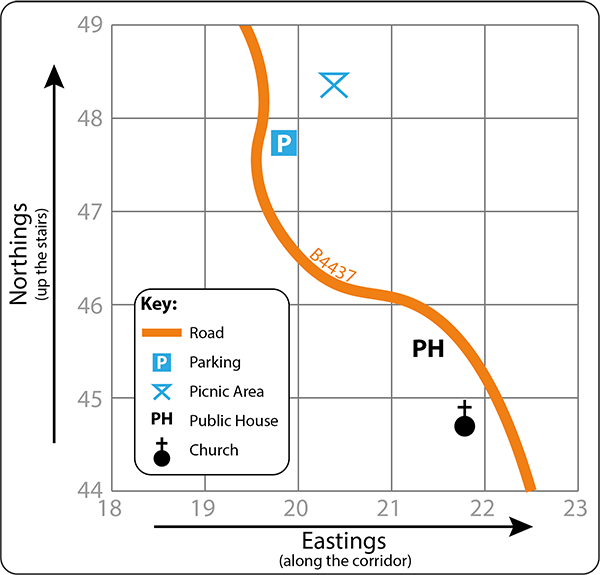
“We will meet at the car park on the B4437 then walk to the picnic site for lunch. We can drive to the pub later on. It’s the one by the road – if you reach the church you’ve gone too far!”

The illustration above shows a simplistic map of the area.
These days, you can find your way to virtually anywhere, thanks to satellite navigation and mobile applications such as Google Maps. However, it is still very useful to have map reading skills. You might find yourself in a situation where there is no mobile signal or your battery is flat.
Every type of map will have a key, which is a list of all the symbols used on the map and what they mean, and a numbered grid, which is unique to that area. The Ordnance Survey in the UK is one of the most well-known map producers in the world. Any location mapped by the OS has a unique grid reference, which is its coordinates. Regardless of whether it is a windmill in Norfolk, or a triangulation point on a Scottish mountain, you can find it on a map if you have its grid reference.
Coordinates on a map are either four-figure or six-figure grid references. The Cartesian x-axis is replaced by eastings and the y-axis by northings. The coordinates of a point are found in the same way as in a Cartesian system – along the corridor and up the stairs!
A four-figure grid reference gives the square on the map that contains the location. The coordinates are the point at the lower left-hand corner of the square. For example, your car park can be found at 1947 and the pub at 2145.
But what about if we need a much more accurate description of the location? In the example, you would need to know the exact location of the picnic site, as this is some distance away from the car park and road. You need a six-figure grid reference in this case.
A six-figure grid reference is obtained by imagining that each square of the grid is divided into ten sub-divisions, like units on a piece of graph paper. The four-figure grid-reference for the picnic site is 2048, but by adding the number of tenths to 20 and 48, we can find a more accurate description of the location.
Looking first at the eastings, you can see that the picnic site is just less than halfway between 20 and 21, which you can estimate as being about 20.4, or four-tenths along from 20. The first three digits of your grid reference are therefore written 203. Looking at the northings, you can see that that the location is about a third of the way between 48 and 49, so the second three digits are 483. The picnic site is therefore at 203483.
Have a go at finding the grid reference for the church.
The answer is 218447.
Conclusion
The most important property of a point on a surface or in 3D space is its exact position. This can be measured by using a system of coordinates, such as the Cartesian system.
Understanding how coordinate systems work will help you mathematically when drawing graphs, and could also prevent you from getting lost if you have a map with you.
See also:
Volume | Polygons
Percentages | Averages (Mean, Median and Mode)
