
Presenting Data
See also: Graphs and ChartsWhen and how should you use data in a presentation?
The answer is that you should use figures and numbers whenever they give the best evidence to back up your argument, or to tell your story. But how to present that data is more difficult.
Many people are not interested in tables of numbers, and may struggle to understand graphs. How can you help walk them through the data?
This page is designed to help you to answer that question by setting out some simple rules for presenting data.
Remember that You Are Telling Your Audience a Story
All presentations are basically story-telling opportunities.
Human beings have been hard-wired, over millions of years of evolution, to enjoy and respond to stories. It’s best to work with it, not fight it, because if you tell your audience a story, they are likely to listen much more carefully, and also move towards a logical conclusion: the insight to which you are trying to lead them.
Once you understand this, the issue of using data falls into place: it is to provide evidence of how your story unfolds.
Use Data to Tell the Story
You are not presenting data as such, you are using data to help you to tell your story in a more meaningful way.
This means that whenever you are required to present data, you should be asking yourself:
‘What is the story in this data?’,
and then
‘How best can I tell this story to my audience?’
A Picture Tells a Thousand Words
90% of the information sent to the brain is visual and over 90% of all human communication is visual. Processing text requires our brains to work much harder than when processing images. In fact, the brain can process pictorial information 60,000 times faster than written information.
There is considerable truth in the saying ‘a picture tells a thousand words’. It may not be literally a thousand, but it is often much easier to use a picture than to describe numerical information in words.
The data itself may be vitally important, but without a visual presentation of that data, its impact (and therefore your message) may be lost.
There are many people in the world who do not find it easy to understand numbers.
There are also many people who will simply switch off if you show them figures in a table. But if you present data in a graph or pie chart, you make a pictorial representation of the data. It makes the numbers much easier to understand. Trends and proportions become more obvious.
Consider this set of data:
| Sales | |
| 1st Qtr | 7.5 |
| 2nd Qtr | 3.1 |
| 3rd Qtr | 1.5 |
| 4th Qtr | 1.1 |
Even for the highly numerate, the immediate point is only that there are lot more sales in the first quarter. You would have to do some adding up and dividing to work out the relationships between the four numbers. It also requires much more concentration to read and absorb the information in this format.
Now consider the same data in a pie chart:
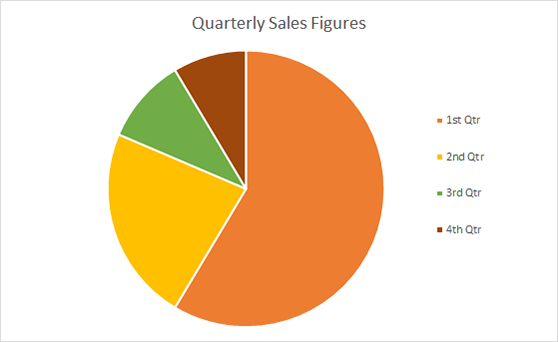
It is immediately and shiningly obvious, even for those who struggle with numbers, that more than half of all sales were in the first quarter, and that over 75% were in the first two quarters.
What’s more, nobody is going to be straining from the back of the room to read your figures. You really can see a lot more from a picture.
But, and this is important, make sure that the graph is a good one.
Check that your graph or chart is visually appealing, that all the labels are clear, and that you have used an appropriate type of graph or chart. Poor graph-making is always obvious and can lead to confusion. Your message will also have much more impact if you choose the right type of graph or chart.
For more about this, see our page on Graphs and Charts.
KISS: Keep It Simple, Stupid!
When you’re good at statistics, it’s very tempting to do some really whizzy analysis. And once you’ve done that, you really want to show everyone how clever you are, and how much work you’ve done.
But does it really help to make your point?
No?
Then don’t present it.
In the (relatively rare) cases when you actually need some really whizzy analysis, you then need to ask yourself whether everyone will understand it. And, in these days of presentations being posted on the internet, will the casual reader of your slides understand it later?
Once again, if the answer is ‘probably not’, then don’t use it.
Leave It Out...
If you can’t summarise your analysis in one or two brief and clear sentences, then don’t include it.
It also follows that if you don’t need to include data to make your point, then it may be best not to do so. A slide that is likely to be misunderstood or produce confusion is worse than no slide at all. So cut out all unnecessary data and focus on what you really need to tell your story.
Remember KISS: Keep It Simple, Stupid.
Highlight the Main Features to Draw Out the Insights
We’re not suggesting that you should ‘dumb down’ your presentation, but there is no harm in highlighting the key features, as well as cutting out unnecessary data.
Suppose once again that you are using the sales figures from the last four quarters. You want to show the actual figures. Why not use a highlighting tool to emphasise that the first quarter is more than half?
With PowerPoint and other presentation software, you can make each circle appear separately, as you make your point and discuss the insights.
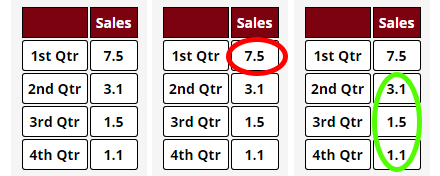
A little creative use of the technology can help you to highlight certain figures, and once again, make the story clearer.
Take-home message
Paradoxically, your presentation of any data should be designed to move the conversation away from the data and into the insight and action that should result from it.
In other words:
‘What happened there?’
and
‘What are we going to do about it?’
If you look at your presentation, data and all, and it’s not clear how you would get from the data to the insight and then the action, it’s probably a good idea to look at it again.
Remember, it’s the story that matters… and then what happens as a result.